Last week we organized a Twitter experiment to learn more on the traffic sent by Twitter to the blog. At this time of the year, the traffic the blog receives is very low and it was thus the perfect time for us to launch this experiment. We created a blog post and tweeted the link @ColinKlinkert a total 6 times over a period of 48 hours (at different times in order to reach most time zones at day time at least once). We also wanted to study the traffic in terms of conversion: Would visitors take action by commenting the post (as we asked them) and get a chance to win $50? Let’s find out!
Overall traffic (over a week)

– 22 total visits on Thursday
– 38 total visits on Friday
– 35 total visits on Saturday
While the overall traffic to the blog is fairly low at this time of the year, we can notice a slight increase during the time of the experiment. This chart has a limited interest for the experiment but at least we can see if there is a significant traffic increase or not. Now let’s move on to the traffic that interests us the most: the Twitter traffic.
Twitter traffic (over a week)

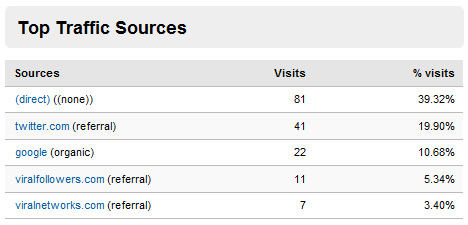
Here we can see that over the week Twitter generated 41 visits to the blog but only 25 between Thursday and Saturday. During that period of time, the blog post we created for the experiment received 26 visits. This can be considered as fairly low for a Twitter account with a list of over 26,300 followers, don’t you think?

Twitter generated traffic to the blog post but not as much as we could have expected. Even though this experiment is not comprehensive enough to draw solid conclusions, we can suggest a few reasons for which the Twitter traffic hasn’t exploded during the period of the experiment and despite the 26,300+ followers @ColinKlinkert.
First, as suggested by several industry experts and confirmed by research firms, Twitter has a lot of members but most of them are inactive (or not active enough to have an impact on the traffic). Secondly, the way the list of followers was built (with tools to be automatically followed by other users) is probably not the most appropriate list building method in terms of conversion. Thirdly, the way we tweeted the links (with call-to-action and link to the blog post) also played a role in the experiment. It is however difficult to evaluate the effectiveness of the calls-to-action.
Out of 26 visits, 4 visitors commented the blog post in time and 2 after the experiment was over. This is a 15 to 23% conversion rate, which isn’t bad but cannot be considered as satisfactory either… Anyhow, the experiment was successful in the way that we were able to study the traffic sent by Twitter to our blog. Have you ever done any similar experiment? If so, please share your own thoughts with us!


 I'm an avid fan of your blog, and the content is always top notch - great reading. I'm always impressed with the variety of content and the way you get all the important steps outlined for processes, but still manage to keep it short and simple - few people do that quite as well.
 Mike Purvis
 Andy Fletcher
 Todd Gross
Nice Experiment. So, can you shed some light on how do we go about building the followers list effectively. Even I have tried following people, but felt inefficient and not worth my time during the time I spent on twitter. Would love to hear your suggestions
Hi Sokrati – Thanks for your support. Well you could ‘pimp’ your Twitter profile for better conversion, and follow people in your niche or industry (so they may follow you back). I don’t think you need to mass follow though… Then as long as you tweet quality content (and not only ads or things like that), your list should grow ‘naturally’. I hope this helps!
Thanks God, finnaly I can folow Colin Klinkert, and I can learning many things from your site,bro.
God bless you Colin.
Best regard from Jakarta,
Yusak Kantadjaya.